Fig. 5
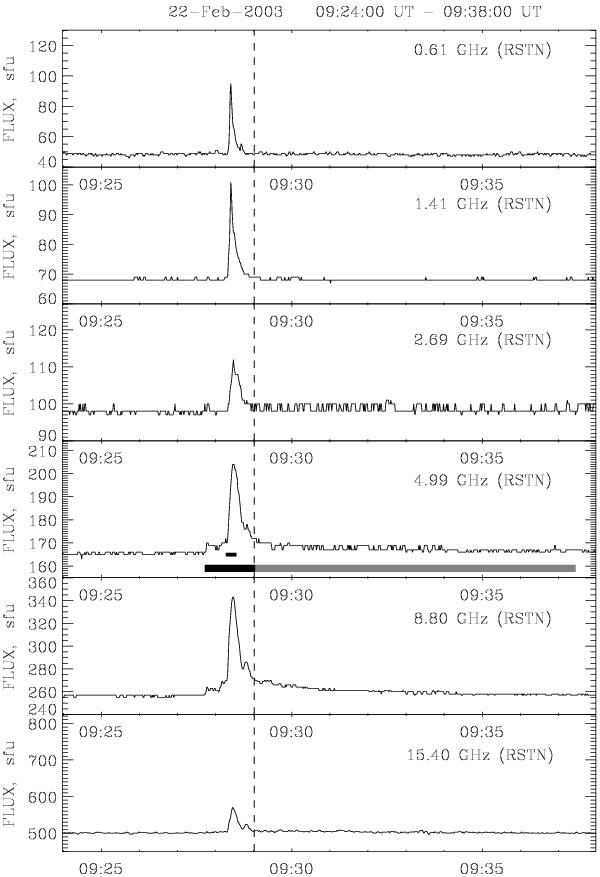
Radio bursts observed on February 22, 2003 at six frequencies 15.40, 8.80, 4.99, 2.69, 1.41, and 0.61 GHz by RSTN. The dashed vertical line at 09:29 UT marks the time of the GOES soft X-ray flare maximum. The heavy black line denotes the time interval with the parameter n ≥ 5 determined from RESIK and the heavy grey line represents time intervals with n < 5. The short black line denotes the time interval when groups of dm-type III bursts were observed, see Fig. 6.
Current usage metrics show cumulative count of Article Views (full-text article views including HTML views, PDF and ePub downloads, according to the available data) and Abstracts Views on Vision4Press platform.
Data correspond to usage on the plateform after 2015. The current usage metrics is available 48-96 hours after online publication and is updated daily on week days.
Initial download of the metrics may take a while.