Fig. 7
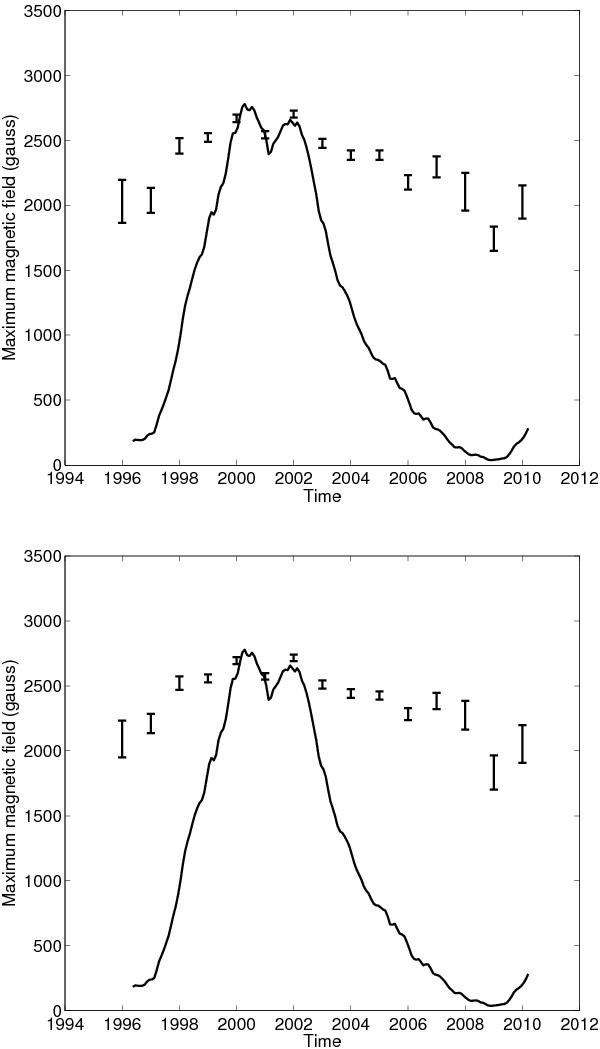
The data shown in Fig. 6 have been binned by year and the mean of each bin is plotted here. Top panel: all data from Fig. 6 are included. Bottom panel: only measurements with a field above 1500 Gauss are included. The error bars correspond to the standard error on the mean. The solid line shows the evolution of the international sunspot number over the same period for reference. Assuming a linear trend gives a gradient of −23.6 ± 3.9 Gauss per year and −22.3 ± 3.9 Gauss per year respectively.
Current usage metrics show cumulative count of Article Views (full-text article views including HTML views, PDF and ePub downloads, according to the available data) and Abstracts Views on Vision4Press platform.
Data correspond to usage on the plateform after 2015. The current usage metrics is available 48-96 hours after online publication and is updated daily on week days.
Initial download of the metrics may take a while.