Fig. 4
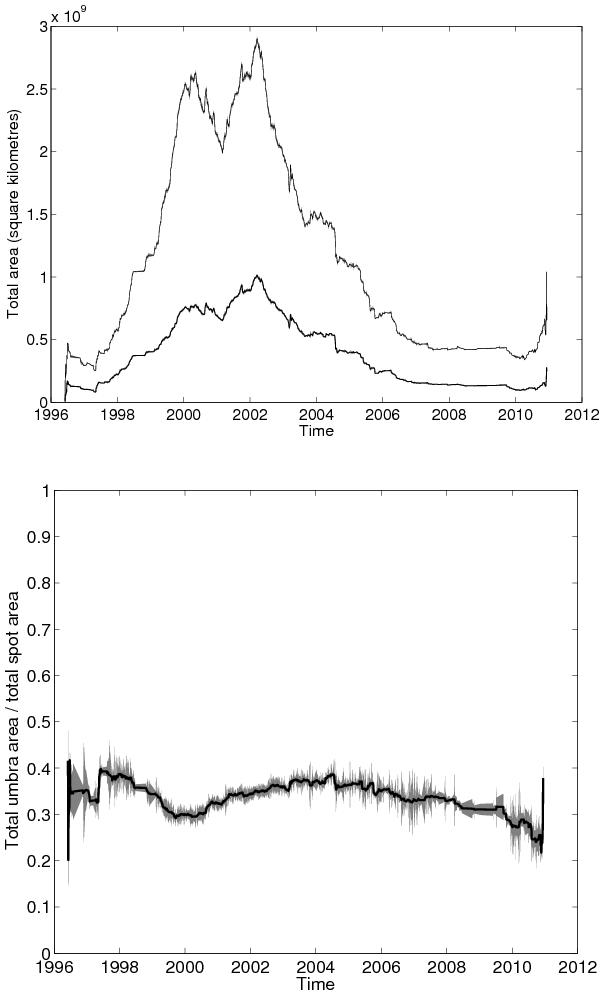
Top panel: the upper line shows the total observed sunspot area and the lower line shows the total umbra area smoothed over three month periods and corrected for foreshortening effects. Only sunspots within 60° of the centre of the disk were used to minimise errors from this correction. Bottom panel: the ratio of total umbral area to total sunspot area. This ratio is fairly constant, with the umbral area consiting of 30−40% of the total sunspot area and does not vary rapidly throughout the cycle. The errors are shown by the shaded area and are lower between 1999 and 2005 due to the increased number of sunspots at that time.
Current usage metrics show cumulative count of Article Views (full-text article views including HTML views, PDF and ePub downloads, according to the available data) and Abstracts Views on Vision4Press platform.
Data correspond to usage on the plateform after 2015. The current usage metrics is available 48-96 hours after online publication and is updated daily on week days.
Initial download of the metrics may take a while.