Free Access
Fig. 3
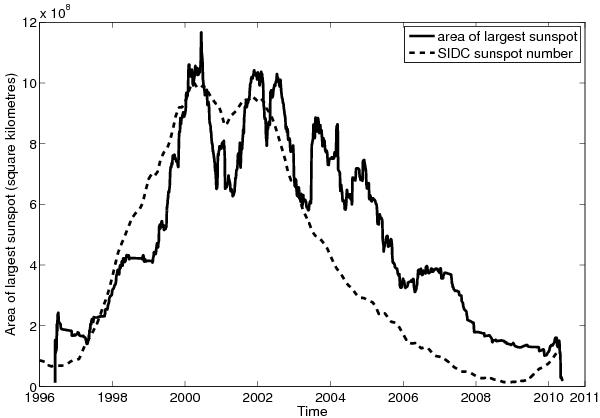
The area of the largest sunspot observed is shown here, smoothed over 3 months to minimise the effect of very large sunspots and days where no spots were visible. This roughly follows the international sunspot number as well as the activity seen throughout solar cycle 23.
Current usage metrics show cumulative count of Article Views (full-text article views including HTML views, PDF and ePub downloads, according to the available data) and Abstracts Views on Vision4Press platform.
Data correspond to usage on the plateform after 2015. The current usage metrics is available 48-96 hours after online publication and is updated daily on week days.
Initial download of the metrics may take a while.