Fig. 3
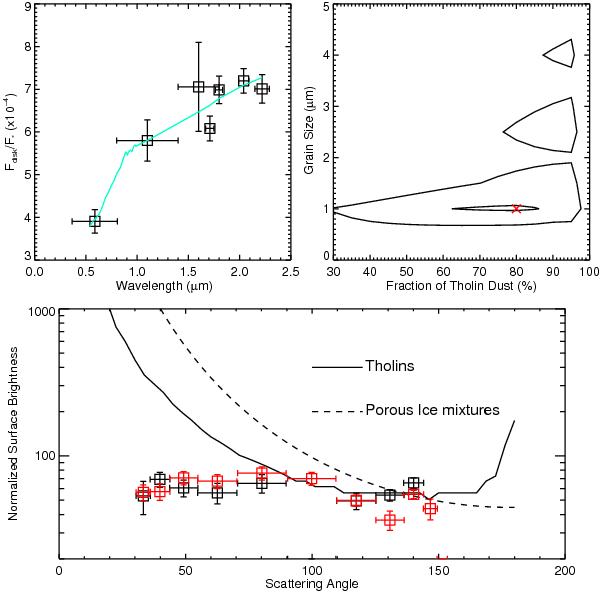
(Top left) Scattering efficiency Fdisk/F ⋆ as a function of wavelength for the HR 4796A debris disk. Horizontal error bars represent the width of the filter for each image of the disk, and the solid line is the best fitting mixture of Titan tholins and astronomical silicates (amin = 1 μm (grain size), 20% Silicates, 80% Tholins). (Top right) Contours of the 68.5% and 98% confidence levels for the models of HR 4796A’s scattered light as a function of minimum grainsize and Tholin fraction. The X represents the best fitting model with a  = 0.98. (Bottom) Relative scattered light surface brightness at visible wavelengths for the HR 4796A debris disk as a function of inferred scattering angle for dust grains in the disk. Grey squares represent the south-west lobe of the ring corrected for the brightness asymmetry present in the ansae of the disk (Schneider et al. 2009) while black squares represent the north-east lobe. Overplotted are phase functions of a) a porous mixture of ices, silicates, and carbonaceous material assuming a Henyey-Greenstein approximation to the phase function and b) Tholins assuming a Mie scattering model phase function.
Current usage metrics show cumulative count of Article Views (full-text article views including HTML views, PDF and ePub downloads, according to the available data) and Abstracts Views on Vision4Press platform.
Data correspond to usage on the plateform after 2015. The current usage metrics is available 48-96 hours after online publication and is updated daily on week days.
Initial download of the metrics may take a while.