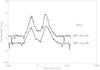
Fig. 1
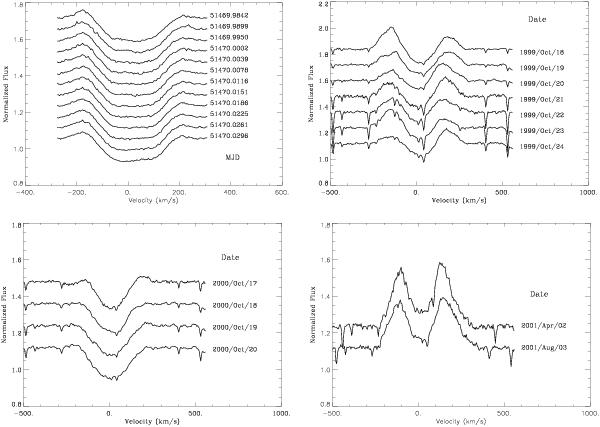
Observed spectra of λ Pavonis: (upper left) He i6678 Å line profiles concerning to 1999 Oct. 18; (upper right) Hα profiles of 1999 observational season, exhibiting V/R rapid variability; (lower left) Hα profiles of 2000 observational season, showing an almost quiescent phase; (lower right) Hα profiles of 2001, with increasing line activity.
Current usage metrics show cumulative count of Article Views (full-text article views including HTML views, PDF and ePub downloads, according to the available data) and Abstracts Views on Vision4Press platform.
Data correspond to usage on the plateform after 2015. The current usage metrics is available 48-96 hours after online publication and is updated daily on week days.
Initial download of the metrics may take a while.