Free Access
Fig. 8
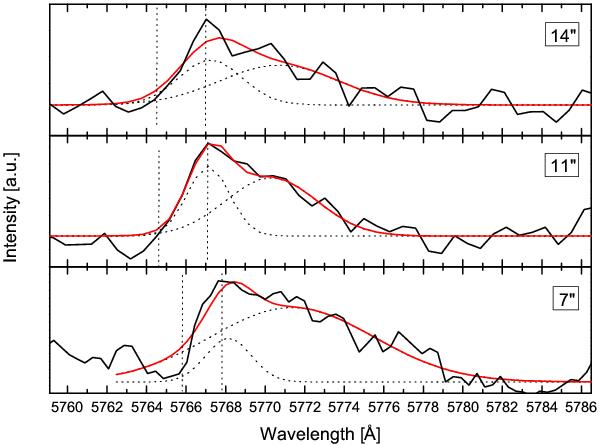
The emission band at 5768 Å for three different offsets at 7, 11 and 14′′. The band was fitted (red line) using two Gaussians, indicated by the dotted lines. The bandshift is indicated with the vertical dotted lines showing the band peak position and the band onset for the three different distances.
Current usage metrics show cumulative count of Article Views (full-text article views including HTML views, PDF and ePub downloads, according to the available data) and Abstracts Views on Vision4Press platform.
Data correspond to usage on the plateform after 2015. The current usage metrics is available 48-96 hours after online publication and is updated daily on week days.
Initial download of the metrics may take a while.