Fig. 7
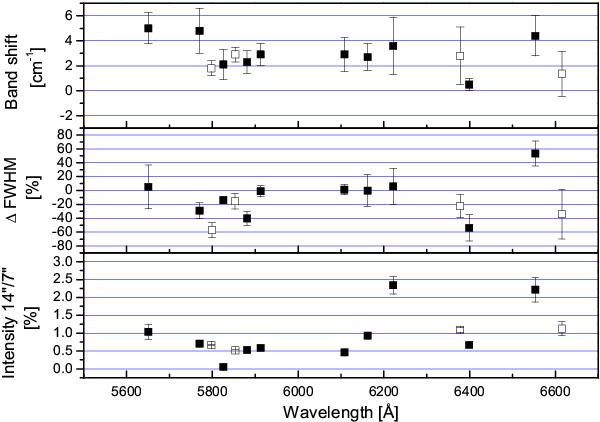
The relative spectral changes for band peak position (upper panel, cm-1) and bandwidth (FWHM) (middle panel, in %) are shown. The lowest panel gives the intensity changes of the emission bands by comparing the values at 14′′ and 7′′. The indicated uncertainties are 1σ-errors. The open squares include the band complex between 5800 and 5900 Å, the band at 6378 Å and the emission band at ~6615 Å, that all have been reported previously (Schmidt & Witt 1991; Scarrott et al. 1992; Sarre et al. 1995; Van Winckel et al. 2002; Sharp et al. 2006).
Current usage metrics show cumulative count of Article Views (full-text article views including HTML views, PDF and ePub downloads, according to the available data) and Abstracts Views on Vision4Press platform.
Data correspond to usage on the plateform after 2015. The current usage metrics is available 48-96 hours after online publication and is updated daily on week days.
Initial download of the metrics may take a while.