Free Access
Fig. 10
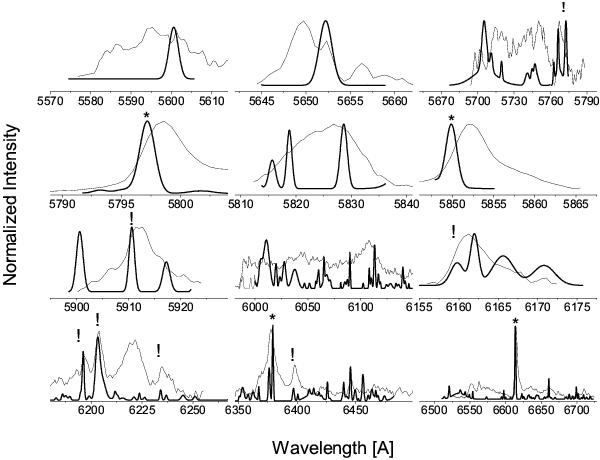
The Red Rectangle emission spectrum taken at 11′′, subdivided into 12 separate plots for convenience. The emission bands of the Red Rectangle are plotted in black. Overplotted is the “inverted” DIB spectrum as thick black line Hobbs et al. (2009). Bands that show an asterisk have been compared to DIBs previously.
Current usage metrics show cumulative count of Article Views (full-text article views including HTML views, PDF and ePub downloads, according to the available data) and Abstracts Views on Vision4Press platform.
Data correspond to usage on the plateform after 2015. The current usage metrics is available 48-96 hours after online publication and is updated daily on week days.
Initial download of the metrics may take a while.