Fig. 3
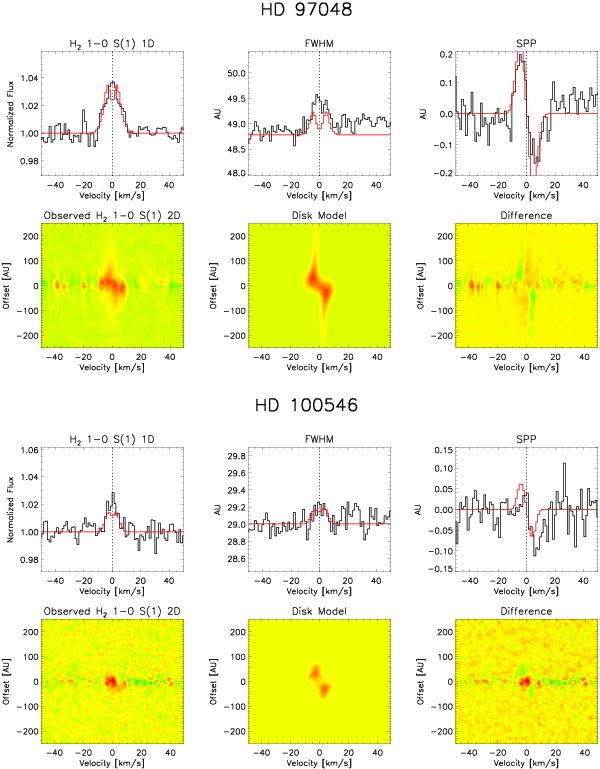
Observed and modeled spectrum for HD 97048 and HD 100546. For each star, the upper three panels display the observed (in black) and the modeled (in red) H2 1-0 S(1) extracted 1D line profile, the FWHM of the PSF, and the spatial peak position (SPP., i.e. center of Gaussian fit to the PSF). The lower three panels show the position–velocity diagrams of the 2D spectrum after subtraction of the continuum PSF. The first panel displays the observed 2D spectrum, the second shows the modeled 2D spectrum, and the third their difference. We show a disk model with α = 1.5, Rin = 9 AU, and Rout = 400 AU for HD 97048 and a disk model with α = 1.0 Rin = 20 AU, and Rout = 80 AU for HD 100546. The spatial scale on the figures is 1 AU = 5.6 mas for HD 97048, and 1 AU = 9.7 mas for HD 100546. Note that the H2 lines have been shifted such that their center is at 0 km s-1. The 2007 and 2008 observations of HD 97048 have different slit PA. Because the 2007 data have much better S/N than the 2008 data, we considered for this figure and line modeling only the 2007 data.
Current usage metrics show cumulative count of Article Views (full-text article views including HTML views, PDF and ePub downloads, according to the available data) and Abstracts Views on Vision4Press platform.
Data correspond to usage on the plateform after 2015. The current usage metrics is available 48-96 hours after online publication and is updated daily on week days.
Initial download of the metrics may take a while.