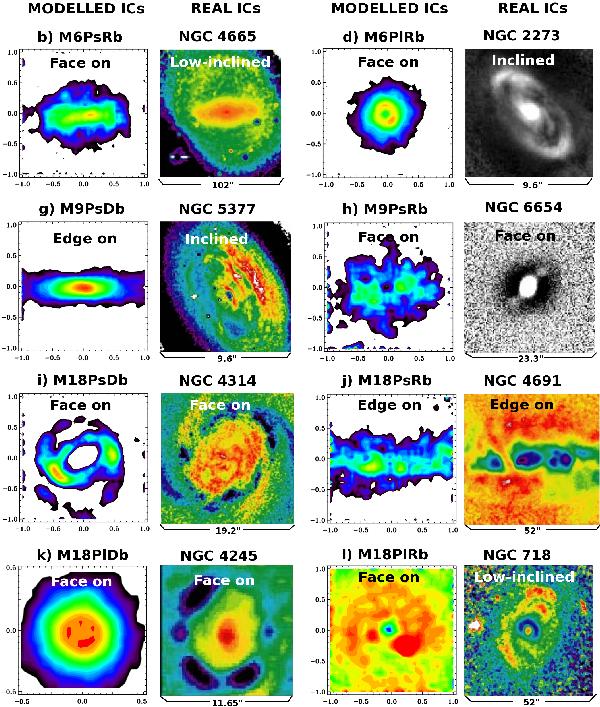
Fig. 16

Comparison of some ICs obtained in our minor merger experiments (first and third columns in the figure) to real observational examples with similar morphologies (second and fourth columns, respectively). The surface density maps of the ICs generated in our models are taken from Figs. 4, 5 and are in simulation units (consult captions there). The observational examples are taken from the sample of spiral galaxies with ICs developed by Erwin & Sparke (2003). Coloured maps of real galaxies correspond to B − R or V − I colour maps of these galaxies, while their grey-scale maps represent unsharp masks in V, R or H bands (see Erwin & Sparke 2003 for a detailed description of each frame). The global inclination of galaxy in the observational cases and the spatial scale of each postage stamp are indicated in each frame. In images of real galaxies, north is up and east is left, except in NGC 4665, which has been rotated 90° clockwise to emphasize the similarity with the IC resulting in experiment M6PsRb (model b). For a comparison of the scaled sizes of the ICs resulting in our models with those exhibited by real ICs, consult Sect. 4. Material from Erwin & Sparke (2003) in this figure is reproduced by permission of the American Astronomical Society (AAS) and of the original authors.
Current usage metrics show cumulative count of Article Views (full-text article views including HTML views, PDF and ePub downloads, according to the available data) and Abstracts Views on Vision4Press platform.
Data correspond to usage on the plateform after 2015. The current usage metrics is available 48-96 hours after online publication and is updated daily on week days.
Initial download of the metrics may take a while.


