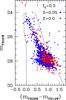
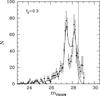
Fig. 3
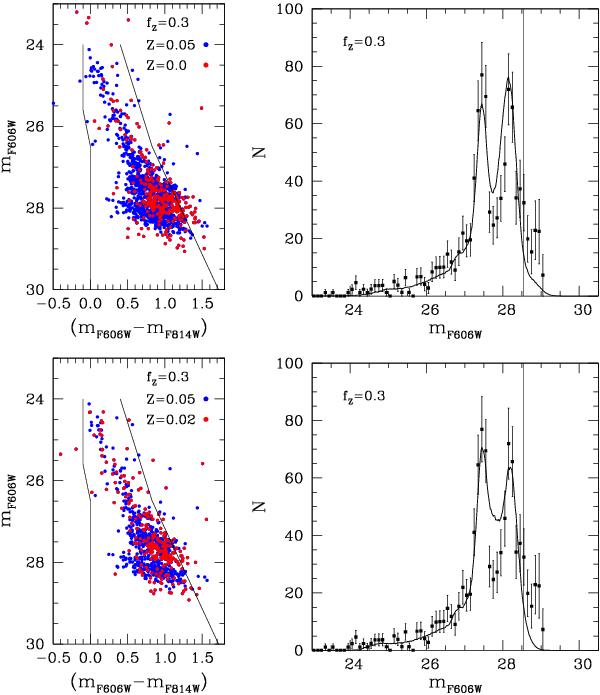
Color–color diagrams (left panels) of the simulated subpopulations of white dwarfs with metal-rich progenitors (blue circles) and metal-poor progenitors (red circles), for two metallicites of the subpopulations, Z = 0.0 (top panel) and Z = 0.02 (bottom panel). In both cases we show the results for a fraction of the subpopulation fZ = 0.3. The resulting white-dwarf luminosity functions (solid lines) are compared to the observational one (squares) in the right panels. See the online edition of the journal for a color version of this plot.
Current usage metrics show cumulative count of Article Views (full-text article views including HTML views, PDF and ePub downloads, according to the available data) and Abstracts Views on Vision4Press platform.
Data correspond to usage on the plateform after 2015. The current usage metrics is available 48-96 hours after online publication and is updated daily on week days.
Initial download of the metrics may take a while.