Fig. 1
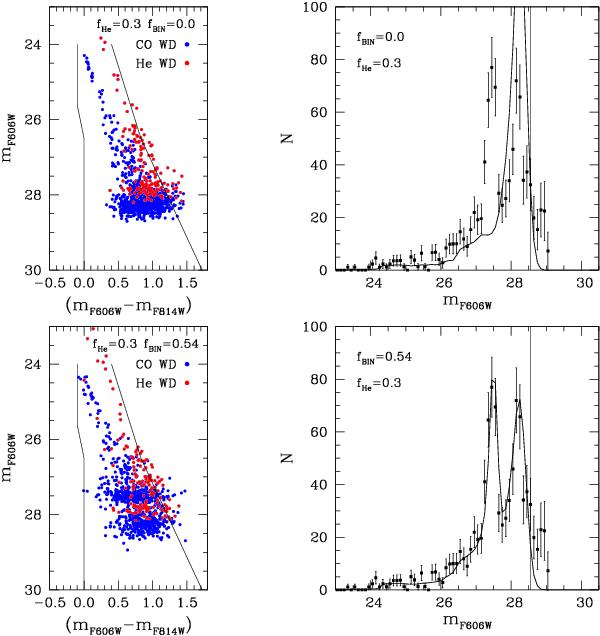
Color–magnitude diagrams (left panels) of the synthetic population of carbon-oxygen white dwarfs (blue symbols) and of helium-core white dwarfs (red symbols) and the corresponding white-dwarf luminosity functions (right panels). The observational selection area in the color–magnitude diagram of Bedin et al. (2005) is also shown using thin lines. These boundaries in the color–magnitude exclude low-mass helium-core white dwarfs. The observational white-dwarf luminosity function of Bedin et al. (2008b), which was corrected for incompleteness, is shown using black squares. Each theoretical luminosity function corresponds to an average of 104 Monte Carlo realizations. The vertical thin line marks the magnitude limit ≃ 28.5mag above which the completeness level of the photometry falls below 50%. The top panels correspond to the case in which fHe = 0.3 and fbin = 0.0 are adopted, while for the bottom ones we adopted fHe = 0.3 and fbin = 0.54. See the online edition of the journal for a color version of this figure.
Current usage metrics show cumulative count of Article Views (full-text article views including HTML views, PDF and ePub downloads, according to the available data) and Abstracts Views on Vision4Press platform.
Data correspond to usage on the plateform after 2015. The current usage metrics is available 48-96 hours after online publication and is updated daily on week days.
Initial download of the metrics may take a while.