Fig. 5
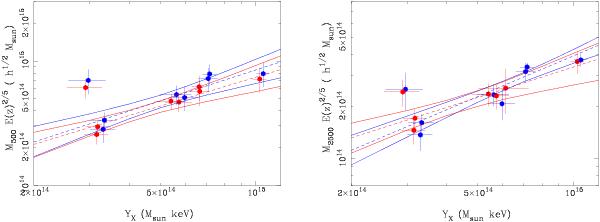
The YX − M500 and YX − M2500 scaling relations for a sample of eight relaxed galaxy clusters. The blue data points and curves correspond to the measurements obtained from a uniform helium abundance case and red data points and curves correspond to the measurements obtained from a helium sedimentation model. The dashed lines show the best fit power law relation and solid curves show the 90% confidence levels.
Current usage metrics show cumulative count of Article Views (full-text article views including HTML views, PDF and ePub downloads, according to the available data) and Abstracts Views on Vision4Press platform.
Data correspond to usage on the plateform after 2015. The current usage metrics is available 48-96 hours after online publication and is updated daily on week days.
Initial download of the metrics may take a while.