Free Access
Fig. 3
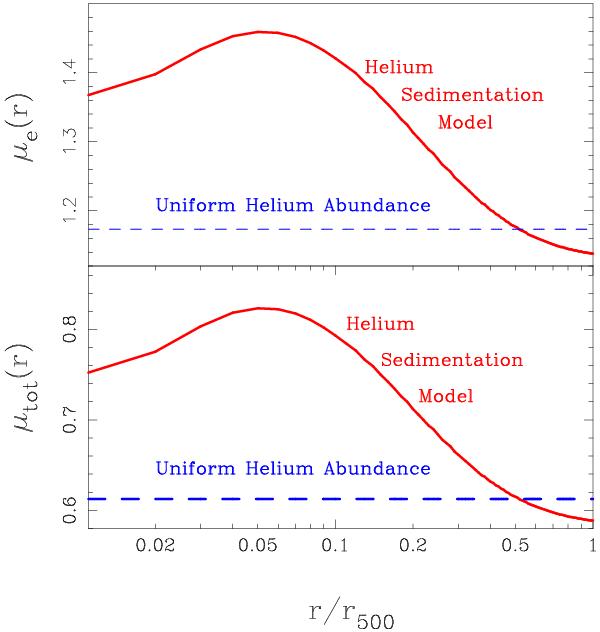
Distributions of the electron mean molecular weight (top panel) and the total mean molecular weight (bottom panel) as a function of radius for a uniform Anders & Grevesse (1989) helium abundance (blue dashed line) and for the 11 Gyr helium sedimentation model Peng & Nagai (2009)(red line).
Current usage metrics show cumulative count of Article Views (full-text article views including HTML views, PDF and ePub downloads, according to the available data) and Abstracts Views on Vision4Press platform.
Data correspond to usage on the plateform after 2015. The current usage metrics is available 48-96 hours after online publication and is updated daily on week days.
Initial download of the metrics may take a while.