Fig. 5
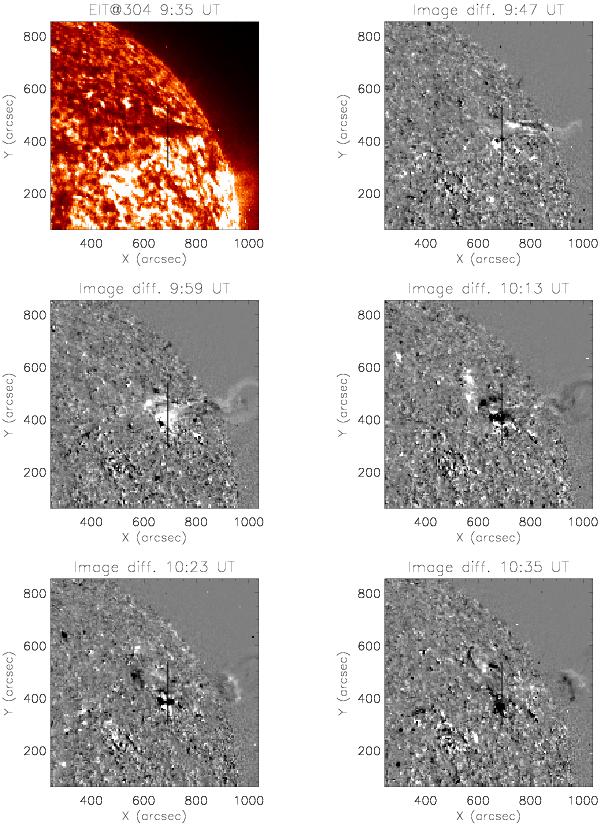
Top left: EIT image of the area of the filament studied, in 304 Å obtained at 9:35 UT, on May 30, 2003. Top right, middle, and bottom rows: EIT difference image sequence of the filament in 304 Å between 9:47 and 10:35 UT (from left to right, top to bottom), obtained at a nearly 12-min cadence. The filament eruption begins at 9:35 UT. The CDS slit position is indicated by a vertical black line.
Current usage metrics show cumulative count of Article Views (full-text article views including HTML views, PDF and ePub downloads, according to the available data) and Abstracts Views on Vision4Press platform.
Data correspond to usage on the plateform after 2015. The current usage metrics is available 48-96 hours after online publication and is updated daily on week days.
Initial download of the metrics may take a while.