Fig. 3
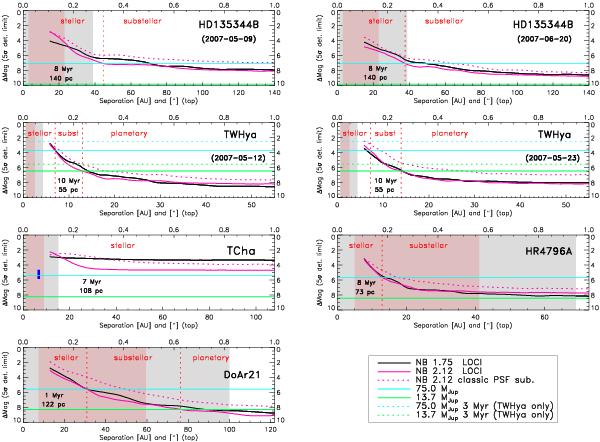
5σ-sensitivity profiles as a function of the distance from the star. The NB_1.75 and NB_2.12 filters are shown in black and pink lines, respectively. For comparison, the dashed curve shows the 5σ-sensitivity for standard PSF-subtracted images at 2.12 μm, not using LOCI. The cyan and green lines mark the approximate positions of 75 and 13.7 MJup, the canonical values that define the substellar and planetary regime boundaries according to the BT-DUSTY models from Allard et al. (2010). The dashed lines represent the same boundaries but for an age of 3 Myr for TW Hya recently reported by Vacca & Sandell (2011). The gray areas show the disk inner hole/gap sizes reported in the literature and the red dashed vertical lines mark the intersections of the LOCI contrast curve at 2.12 μm with the cyan and green lines. They indicate the radial distance from the primary from where the NACO images are sensitive to substellar and planetary mass objects according to the adopted BT-DUSTY model. The pink areas represent the hole/gap distance range where stellar companions could exist according to the models of Artymowicz & Lubow (1994) on basis of the hole/gap size. For typical gaseous viscous disk parameters, and a denoting the binary semi-major axis, the inner edge location of the circumbinary disk varies from 1.7a to 3.3a for binary eccentricity increasing from 0 (circular orbit) to 0.75, and assuming a face-on geometry (i = 0°, PA = 0°). The position of the companion varies from a(1 − e) and a(1 + e), the periapsis and apoapsis of the secondary relative to the primary. For T Cha, the NACO images are only sensitive to stellar mass objects brighter than 4.7 mag in contrast or 0.12 M⊙. The blue vertical bar in the T Cha plot indicate the approximate 5-σ detection limit (ΔKs > 4.65 mag or mass <0.12 M⊙) at the separation (6.7 ± 1 AU) and position angle (~78 ± 1 deg) of the companion candidate detected in the L′-band with NACO by Huélamo et al. (2011). A lower limit of 50 MJup was chosen following Fig. 4b in their paper. This detection is well within the disk hole/gap of T Cha and inside the binary range predicted by Artymowicz & Lubow (1994). The profiles are displayed between 0.1 and 1 arcsec for all stars. Simulations with a fake target of 4 mag in contrast show that the sensitivity curves are reliable as close as 100–120 mas from the primary (between the first and second Airy ring at 2.12 μm). Beyond 1 arcsec and up to 3.3 arcsec the contrast curves remain flat.
Current usage metrics show cumulative count of Article Views (full-text article views including HTML views, PDF and ePub downloads, according to the available data) and Abstracts Views on Vision4Press platform.
Data correspond to usage on the plateform after 2015. The current usage metrics is available 48-96 hours after online publication and is updated daily on week days.
Initial download of the metrics may take a while.