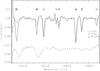
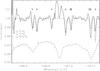
Fig. 3

Averaged spectrum (solid line) of both Venus limbs in the a) “Favorite+” and b) “Favorite” region together with the best-fit model spectrum (dash-dotted line, see text for details). Absorption line positions of the three isotopologues are indicated by different symbols. The dashed line shows a scaled spectrum of the Sun in arbitrary units, showing partial overlap of solar absorption lines with absorption lines from Venus’ atmosphere.
Current usage metrics show cumulative count of Article Views (full-text article views including HTML views, PDF and ePub downloads, according to the available data) and Abstracts Views on Vision4Press platform.
Data correspond to usage on the plateform after 2015. The current usage metrics is available 48-96 hours after online publication and is updated daily on week days.
Initial download of the metrics may take a while.