Fig. 8
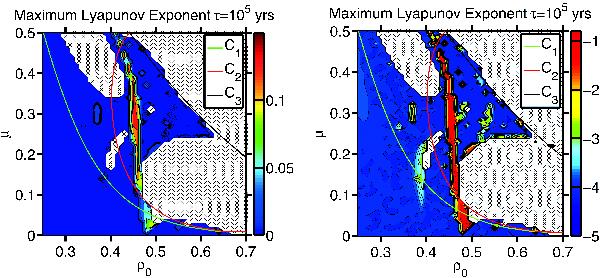
Depiction of the maximum Lyapunov exponent (colour coded) for various mass ratios μ and initial conditions ρ0 using a linear scale (left) or a logarithmic scale (right) where − n corresponds to 10 − n. Crosses denote cases where the simulation was terminated due to the planet being captured by one of the stars or being ejected from the system. Green, red, and black curves represent the initial conditions that cause the ZVC to open at L1, L2, and L3, respectively.
Current usage metrics show cumulative count of Article Views (full-text article views including HTML views, PDF and ePub downloads, according to the available data) and Abstracts Views on Vision4Press platform.
Data correspond to usage on the plateform after 2015. The current usage metrics is available 48-96 hours after online publication and is updated daily on week days.
Initial download of the metrics may take a while.