Fig. 1
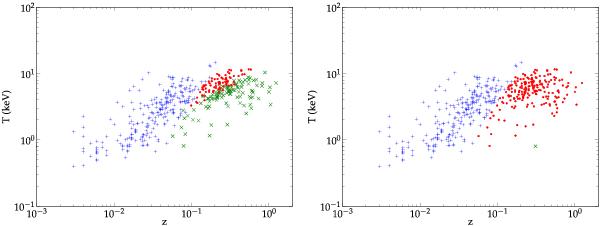
Distribution of temperature and redshift for the cluster sample used for this study and the clusters obtained after selection cuts for one Monte Carlo simulation. Blue plus signs represent clusters from the original sample that were excluded after the angular size cut; green crosses correspond to undetected clusters assuming a detection threshold of 1 × 10⁻³ arcmin2 (left) or 1 × 10⁻⁵ arcmin2 (right). Red dots represent detected clusters under the same detection thresholds. This figure remains essentially unchanged in all simulations performed in this work.
Current usage metrics show cumulative count of Article Views (full-text article views including HTML views, PDF and ePub downloads, according to the available data) and Abstracts Views on Vision4Press platform.
Data correspond to usage on the plateform after 2015. The current usage metrics is available 48-96 hours after online publication and is updated daily on week days.
Initial download of the metrics may take a while.