Fig. 7
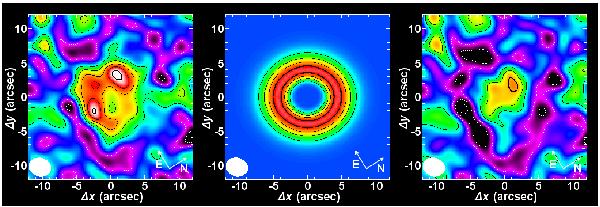
Observed CARMA 1.3 mm map (left), modeled image (center), and model subtracted map (right). The contour levels have increments of 1σ. White, dashed levels start at −1σ and indicate negative values, while black, solid levels start at 1σ and indicate positive values, where 1σ = 0.35 mJy/beam. A bold line is used to mark the maximum contour in each image. The FWHM of the synthesized beam ( ) is shown in the lower-left corner. The images have been rotated, so that the major axis, as derived from the scattered light images, is oriented along the x-axis.
Current usage metrics show cumulative count of Article Views (full-text article views including HTML views, PDF and ePub downloads, according to the available data) and Abstracts Views on Vision4Press platform.
Data correspond to usage on the plateform after 2015. The current usage metrics is available 48-96 hours after online publication and is updated daily on week days.
Initial download of the metrics may take a while.