Fig. 4
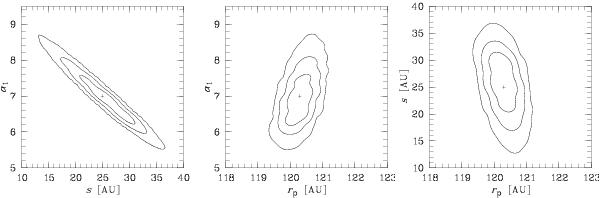
Projection of the three dimensional ellipsoids of constant χ2 on the rp = const. (left), s = const. (center), and α1 = const. (right) planes from fitting the F606W image. The contour levels show 1σ, 2σ, and 3σ levels of confidence, respectively. The cross indicates the position of the best-fit values. The plots illustrate very well the correlation between α1 and s and the very weak correlations between these parameters and rp, respectively. For a detailed description of the parameters shown see Sect. 4.1.1.
Current usage metrics show cumulative count of Article Views (full-text article views including HTML views, PDF and ePub downloads, according to the available data) and Abstracts Views on Vision4Press platform.
Data correspond to usage on the plateform after 2015. The current usage metrics is available 48-96 hours after online publication and is updated daily on week days.
Initial download of the metrics may take a while.