Fig. 5
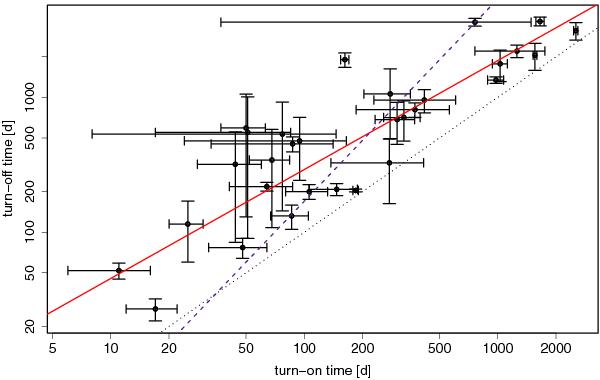
Double logarithmic plot of turn-on time versus turn-off time (both in days after outburst) including error bars. The solid red line represents the best fit from a weighted regression. The dashed purple line shows the toff vs. ton relation of Hachisu & Kato (2010). The dotted black line indicates the limiting case of toff = ton.
Current usage metrics show cumulative count of Article Views (full-text article views including HTML views, PDF and ePub downloads, according to the available data) and Abstracts Views on Vision4Press platform.
Data correspond to usage on the plateform after 2015. The current usage metrics is available 48-96 hours after online publication and is updated daily on week days.
Initial download of the metrics may take a while.