Fig. 14
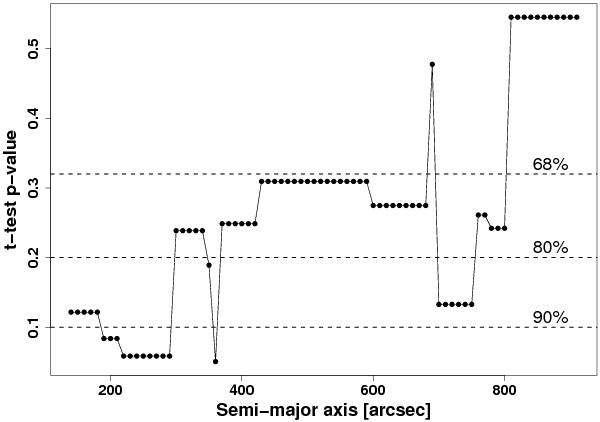
Two-sample t-test p-values for the blackbody kT distributions of old and young novae. The abscissa gives the semi-major axis of the “bulge” region which is defined to contain the old novae. The solid line connects the solid circles of the data points for better readability. Dashed lines show three acceptance levels for the t-test.
Current usage metrics show cumulative count of Article Views (full-text article views including HTML views, PDF and ePub downloads, according to the available data) and Abstracts Views on Vision4Press platform.
Data correspond to usage on the plateform after 2015. The current usage metrics is available 48-96 hours after online publication and is updated daily on week days.
Initial download of the metrics may take a while.