Fig. 1
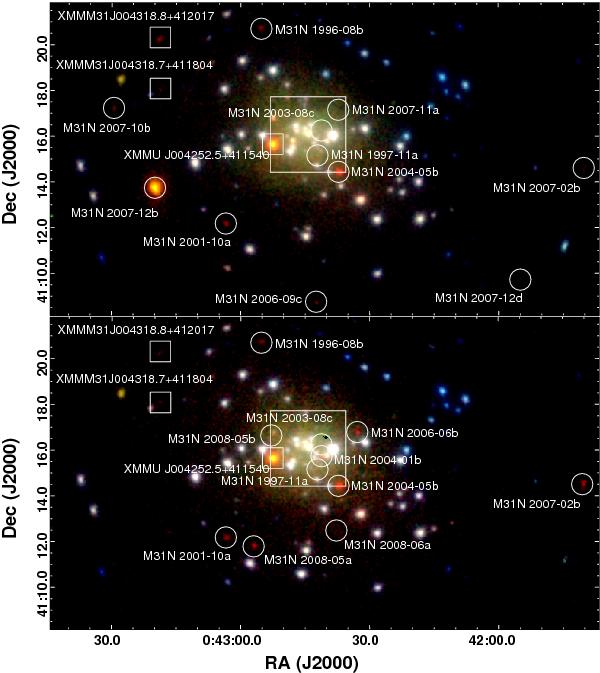
Logarithmically scaled, three colour XMM-Newton EPIC images of the central area of M 31 combining PN, MOS1, and MOS2 data of all five observations for 2007/8 (top panel) and 2008/9 (bottom panel). Red, green, and blue show the (0.2–0.5) keV, (0.5–1.0) keV and (1.0–2.0) keV bands. Supersoft X-ray sources show up in red. The data in each colour band were binned in 2″ × 2″ pixels and smoothed using a Gaussian of FWHM 5″. The counterparts of optical novae detected in this work are marked with white circles. For M31N 1997-11a, M31N 2003-08c, M31N 2004-01b, M31N 2007-11a, M31N 2008-05b, and M31N 2008-06a only the positions are designated, because they are not visible in these images but are detected in Chandra images. The non-nova SSSs detected in this work are marked with white boxes. The large white box includes the central region of M 31, which is shown as a Chandra composite in Fig. 2.
Current usage metrics show cumulative count of Article Views (full-text article views including HTML views, PDF and ePub downloads, according to the available data) and Abstracts Views on Vision4Press platform.
Data correspond to usage on the plateform after 2015. The current usage metrics is available 48-96 hours after online publication and is updated daily on week days.
Initial download of the metrics may take a while.