Fig. 1
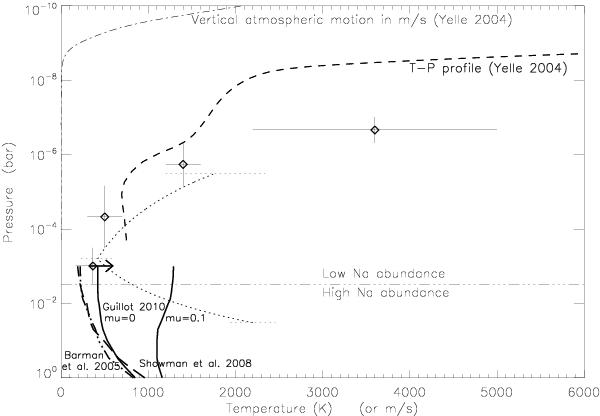
Plot of the new T-P profile (diamonds). The symbols are the same as in Fig. 9 of Vidal-Madjar et al. (2011). The vertical error bars show the altitude regime over which we fit each temperature. The new T-P profile remains consistent with the T-P profile obtained by Sing et al. (2008) using a parametric fit of the same data set (dotted line).
Current usage metrics show cumulative count of Article Views (full-text article views including HTML views, PDF and ePub downloads, according to the available data) and Abstracts Views on Vision4Press platform.
Data correspond to usage on the plateform after 2015. The current usage metrics is available 48-96 hours after online publication and is updated daily on week days.
Initial download of the metrics may take a while.