Fig. 9
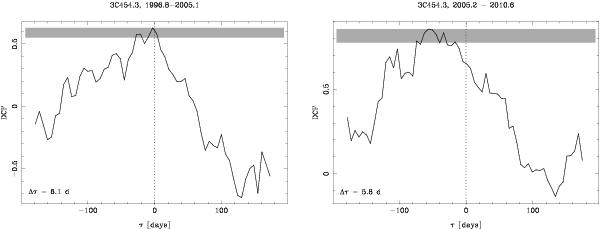
Like Fig. 8, for 3C 454.3 before 2005.2 (left panel) and after 2005.2 (right panel). During the “quiescent” phase before 2005.2, the peak of the DCF is in good agreement with a time delay of zero. We note the low absolute value of the correlation, DCF(0) ≈ 0.6. For the “flaring” phase after 2005.2, we find a significant time delay in the range (as defined by the 3σ confidence interval) of ~ −15...−80 days, peaking at τ ≈ −55 days. The negative delay indicates that the 1.3-mm lightcurve is ahead in time of the 3-mm lightcurve.
Current usage metrics show cumulative count of Article Views (full-text article views including HTML views, PDF and ePub downloads, according to the available data) and Abstracts Views on Vision4Press platform.
Data correspond to usage on the plateform after 2015. The current usage metrics is available 48-96 hours after online publication and is updated daily on week days.
Initial download of the metrics may take a while.