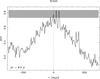
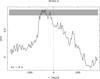
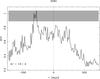
Fig. 8
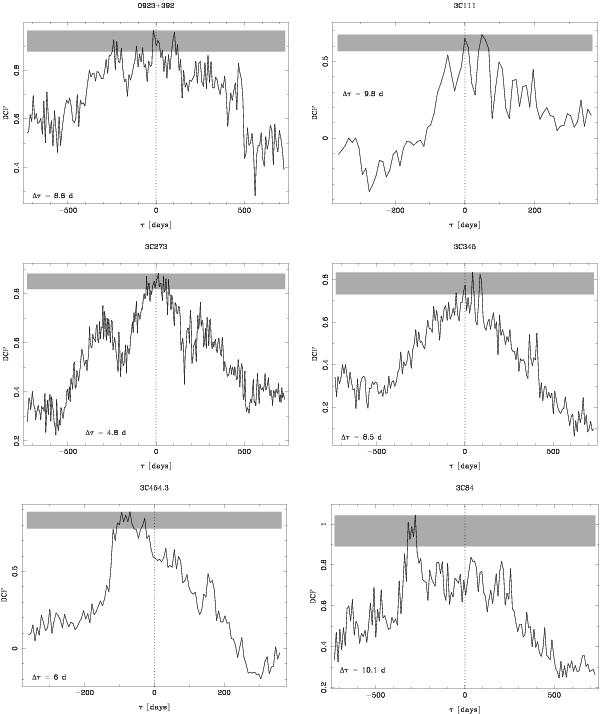
Discrete correlation functions (DCF) as functions of time lags τ between the 1.3-mm and 3-mm lightcurves (see Fig. 1) of each AGN. The black graphs indicate the measured DCF, bin sizes Δτ are indicated in the corresponding diagrams. The maxima of the curves correspond to the most probable time lag between the spectral bands. Grey shaded areas mark the DCF ranges [max(DCF),max(DCF) − 3σ] with σ being the statistical error of max(DCF). Thus all values located within the shaded area are consistent with the maximum of the DCF curve within 3σ confidence. A positive (negative) time lag means that the 3-mm lightcurve preceeds (lags behind) the 1.3-mm lightcurve. Vertical dashed lines mark the null positions of the time lag axes, corresponding to the absence of time lags.
Current usage metrics show cumulative count of Article Views (full-text article views including HTML views, PDF and ePub downloads, according to the available data) and Abstracts Views on Vision4Press platform.
Data correspond to usage on the plateform after 2015. The current usage metrics is available 48-96 hours after online publication and is updated daily on week days.
Initial download of the metrics may take a while.