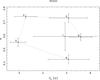
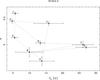
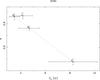
Fig. 5
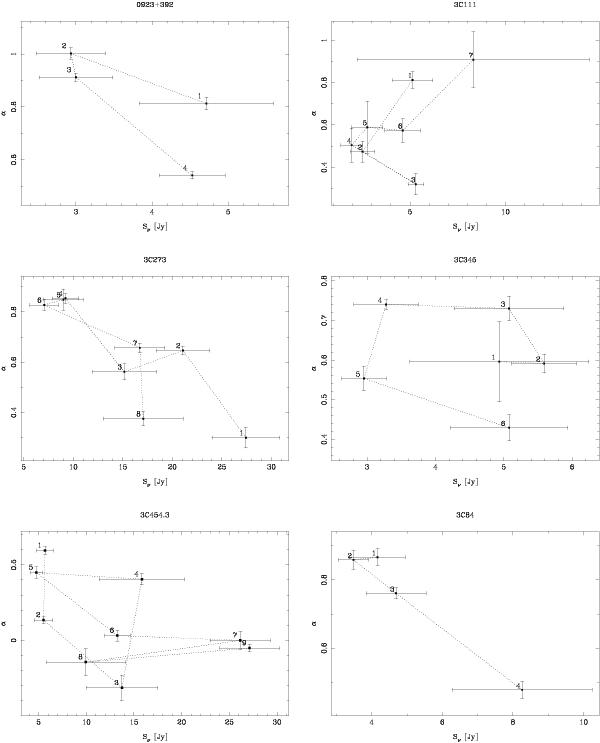
Evolution of the spectral index α as function of the 3-mm flux. The data points are connected by dotted lines according to their order in time. Labels 1−3, ... mark the first, second, third, ... measurement in time. The time bins used here are those defined for Fig. 4. Error bars along the flux axis denote the flux variability (standard deviation), error bars along the α axis denote statistical 1σ errors.
Current usage metrics show cumulative count of Article Views (full-text article views including HTML views, PDF and ePub downloads, according to the available data) and Abstracts Views on Vision4Press platform.
Data correspond to usage on the plateform after 2015. The current usage metrics is available 48-96 hours after online publication and is updated daily on week days.
Initial download of the metrics may take a while.