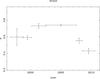
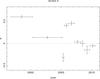
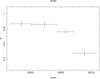
Fig. 4
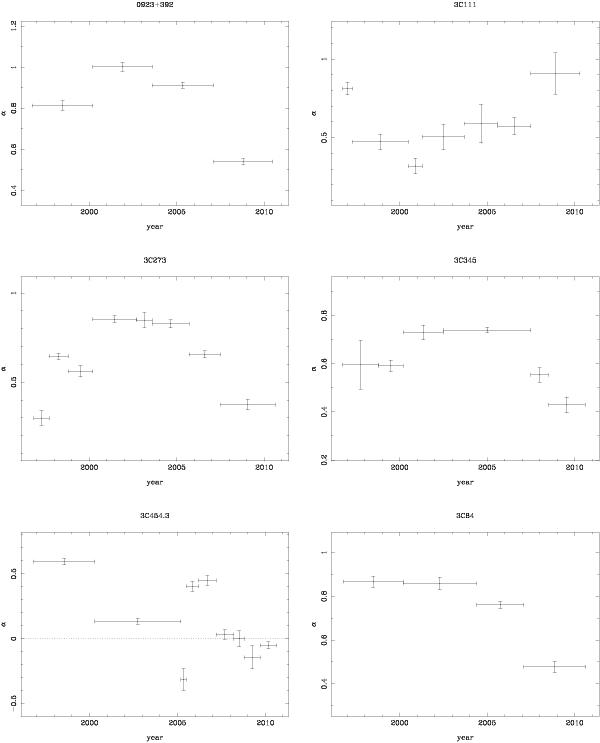
Evolution of the spectral indices from 1996 to 2010. Please note the different axis scales. The spectral index α is defined via Sν ∝ ν−α. Errorbars along the time axes denote the bin sizes, error bars along the α axes denote the statistical 1σ errors. Horizontal dashed lines (where visible) mark the α = 0 lines. For each source we chose the bins such that each bin covers a phase of similar flux levels (quiescent phases, flares).
Current usage metrics show cumulative count of Article Views (full-text article views including HTML views, PDF and ePub downloads, according to the available data) and Abstracts Views on Vision4Press platform.
Data correspond to usage on the plateform after 2015. The current usage metrics is available 48-96 hours after online publication and is updated daily on week days.
Initial download of the metrics may take a while.