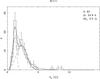
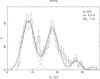
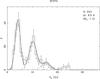
Fig. 2
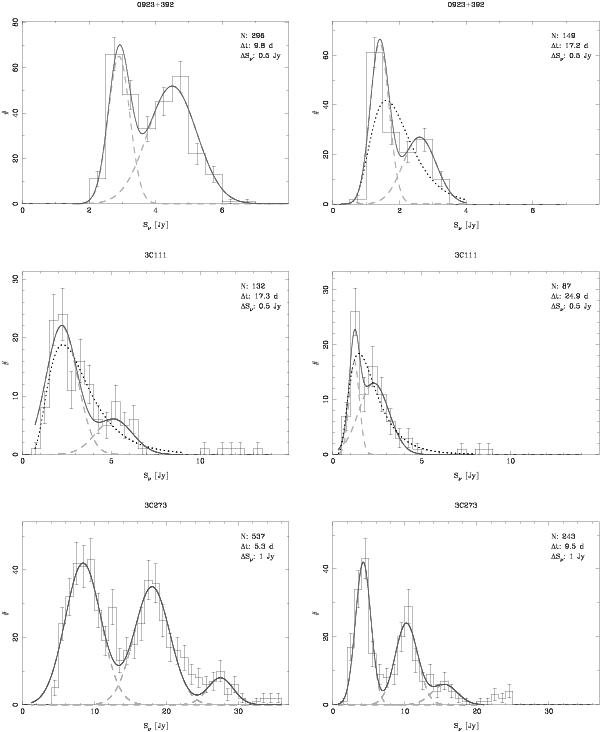
Distributions of the 3-mm (left column) and 1.3-mm band (right column) fluxes of 0923+392, 3C 111, and 3C 273. Please note the different axis scales and bin sizes. In order to minimize the impact of irregular sampling, we binned all lightcurves (compare Fig. 1) in time using N bins with sizes Δt. The parameters N, Δt, and the sizes of the flux bins ΔSν are given in the respective diagrams. Errorbars indicate binomial errors. Continuous grey lines indicate approximations to the data composed of individual Gaussians (dashed grey lines). In three cases (0923+392 at 1.3 mm, 3C 111 at 1.3 mm and 3 mm) we also indicate the best-fitting log-normal distributions (dotted black curves).
Current usage metrics show cumulative count of Article Views (full-text article views including HTML views, PDF and ePub downloads, according to the available data) and Abstracts Views on Vision4Press platform.
Data correspond to usage on the plateform after 2015. The current usage metrics is available 48-96 hours after online publication and is updated daily on week days.
Initial download of the metrics may take a while.