Fig. 10
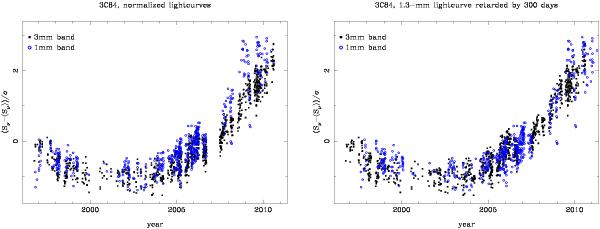
A visualization of the time delay between the 1.3-mm and 3-mm lightcurves of 3C 84. Left panel: the 1.3-mm and 3-mm lightcurves. Each lightcurve is normalized to zero mean and unity standard deviation, in analogy to the calculation of the unbinned discrete correlations according to Eq. (7). Here Sν indicates the flux density, ⟨ Sν ⟩ is the average flux density, and σ denotes the standard deviation of each lightcurve. Right panel: same as left panel, but with the 1.3-mm lightcurve artificially retarded by 300 days. Comparison of the two panel shows improved agreement of the two lightcurves when taking into account the time delay τ ≈ −300 days found from the discrete correlation function; see also Fig. 7, bottom right panel.
Current usage metrics show cumulative count of Article Views (full-text article views including HTML views, PDF and ePub downloads, according to the available data) and Abstracts Views on Vision4Press platform.
Data correspond to usage on the plateform after 2015. The current usage metrics is available 48-96 hours after online publication and is updated daily on week days.
Initial download of the metrics may take a while.