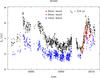
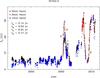
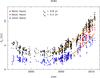
Fig. 1
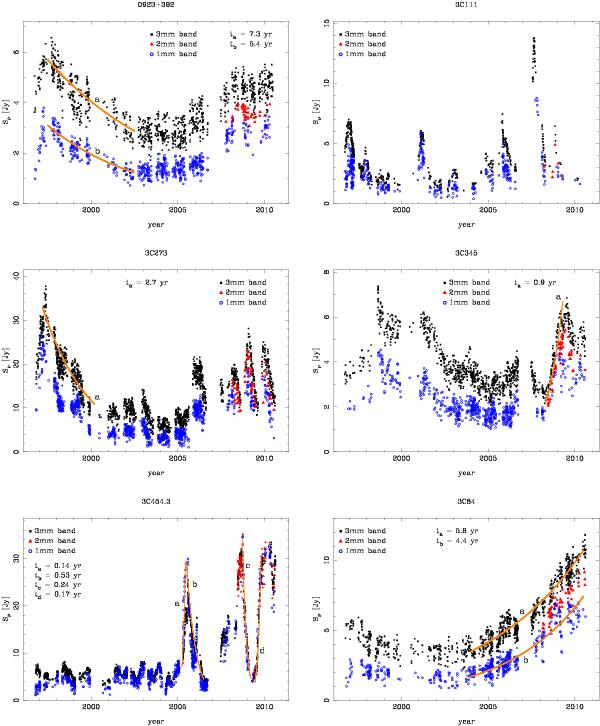
The long-term lightcurves of our six target quasars spanning timelines from 1996 to 2010. Please note the different flux axis scales. For each source we give the fluxes vs. time separatly for the 1.3-mm (here labeled 1-mm for brevity), 2-mm, and 3-mm bands. For each source (except 3C 111) we approximate the most prominent, continuously sampled variations as exponential rises or decays according to Sν ∝ exp(± t/tx) (orange lines). Here t is the time, tx the characteristic rise/decay timescale of the curve labeled x (x = a,b,c,...). The sign of t is + t for exponential rises and −t for decays. All parameters are given in the corresponding diagrams.
Current usage metrics show cumulative count of Article Views (full-text article views including HTML views, PDF and ePub downloads, according to the available data) and Abstracts Views on Vision4Press platform.
Data correspond to usage on the plateform after 2015. The current usage metrics is available 48-96 hours after online publication and is updated daily on week days.
Initial download of the metrics may take a while.