Free Access
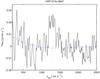
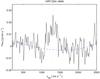
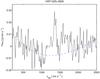
Fig. 5
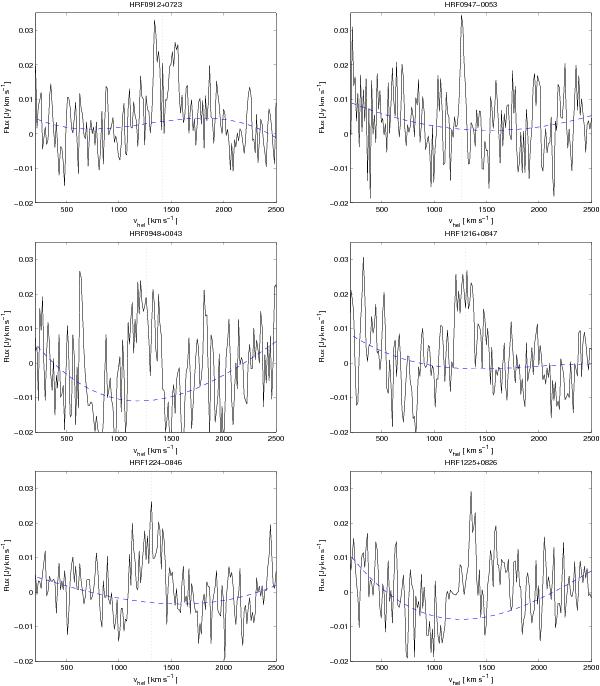
Spectra of H i features that have been detected in the vicinity of other objects, by inspecting the moment maps. A third order polynomial is fit to the bandpass and is indicated by the dashed line. The vertical dotted line represents the radial velocity of the detected feature.
This figure is made of several images, please see below:
Current usage metrics show cumulative count of Article Views (full-text article views including HTML views, PDF and ePub downloads, according to the available data) and Abstracts Views on Vision4Press platform.
Data correspond to usage on the plateform after 2015. The current usage metrics is available 48-96 hours after online publication and is updated daily on week days.
Initial download of the metrics may take a while.