Fig. 3
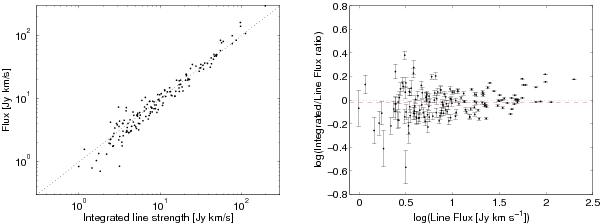
Left panel: flux obtained from the moment maps is plotted as function of the line strength, the dotted line indicates where the two flux measurements are equivalent. Right panel: ratio of integrated flux and line-strength is plotted as function of line-strength on a logarithmic scale. The dotted line indicates where the ratio is one and the fluxes are equivalent. The dashed line shows the median of the ratios.
Current usage metrics show cumulative count of Article Views (full-text article views including HTML views, PDF and ePub downloads, according to the available data) and Abstracts Views on Vision4Press platform.
Data correspond to usage on the plateform after 2015. The current usage metrics is available 48-96 hours after online publication and is updated daily on week days.
Initial download of the metrics may take a while.