Free Access
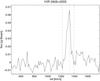
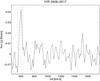
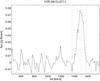
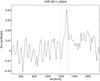
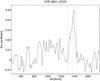
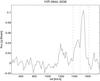
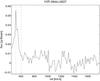
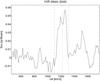
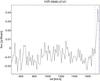
Fig. A.1
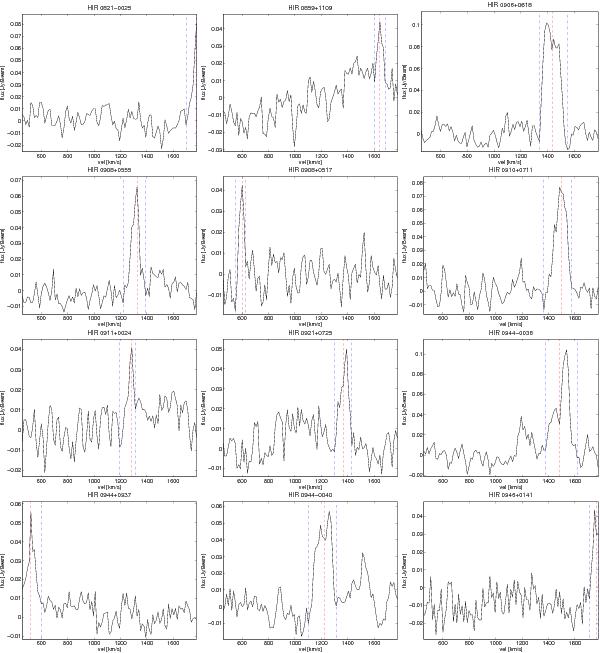
Spectra of all detections of neutral hydrogen in the reprocessed region of the H i Parkes All Sky Survey. The velocity width of each object is indicated by the two blue dash-dotted lines, while the central velocity is shown by the red dashed line.
This figure is made of several images, please see below:
Current usage metrics show cumulative count of Article Views (full-text article views including HTML views, PDF and ePub downloads, according to the available data) and Abstracts Views on Vision4Press platform.
Data correspond to usage on the plateform after 2015. The current usage metrics is available 48-96 hours after online publication and is updated daily on week days.
Initial download of the metrics may take a while.