Free Access
Fig. 1
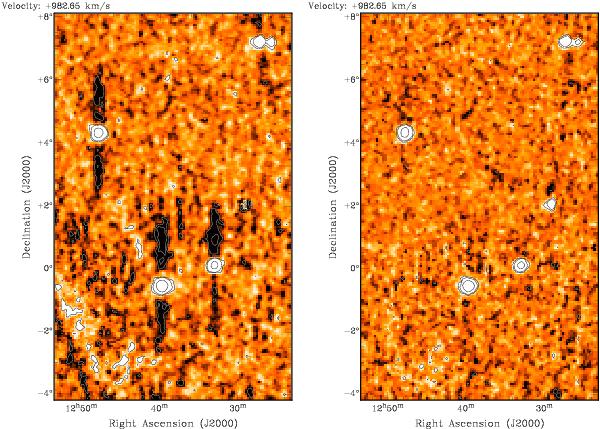
Example of the artefacts in the original HIPASS pipeline (left panel) and the reprocessed data (right panel). Both panels show the same region of the sky at the same velocity, the intensity ranges from −40 to 40 mJy beam-1. Contours are plotted at −60, −30, 30, 60 and 300 mJy beam-1, negative contours are coloured white.
This figure is made of several images, please see below:
Current usage metrics show cumulative count of Article Views (full-text article views including HTML views, PDF and ePub downloads, according to the available data) and Abstracts Views on Vision4Press platform.
Data correspond to usage on the plateform after 2015. The current usage metrics is available 48-96 hours after online publication and is updated daily on week days.
Initial download of the metrics may take a while.