Fig. 8
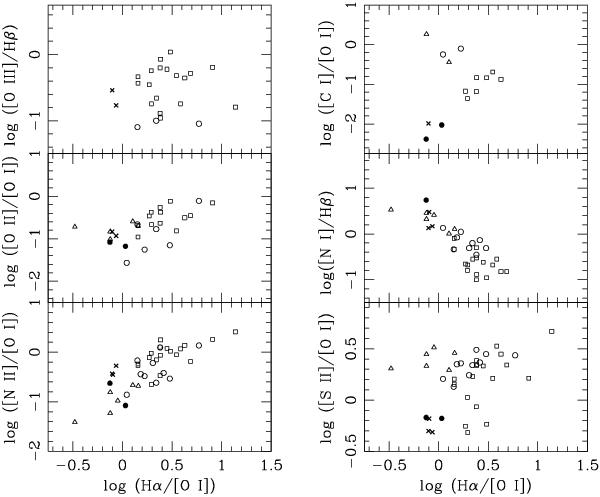
Graph showing six emission line ratios as a function of Hα/[O I] 6300 for several regions of CRL 618 and HH objects (from the compilation of Raga, Böhm & Cantó 1996). Filled circles correspond to features “a1” and “b1” (faint lobe) and crosses correspond to “b2”, “c2” and “d2”. The points corresponding to HH objects are shown with open symbols: the high excitation spectra are shown as open squares, the intermediate excitation spectra are the open circles and the low excitation spectra are the open triangles.
Current usage metrics show cumulative count of Article Views (full-text article views including HTML views, PDF and ePub downloads, according to the available data) and Abstracts Views on Vision4Press platform.
Data correspond to usage on the plateform after 2015. The current usage metrics is available 48-96 hours after online publication and is updated daily on week days.
Initial download of the metrics may take a while.