Fig. 6
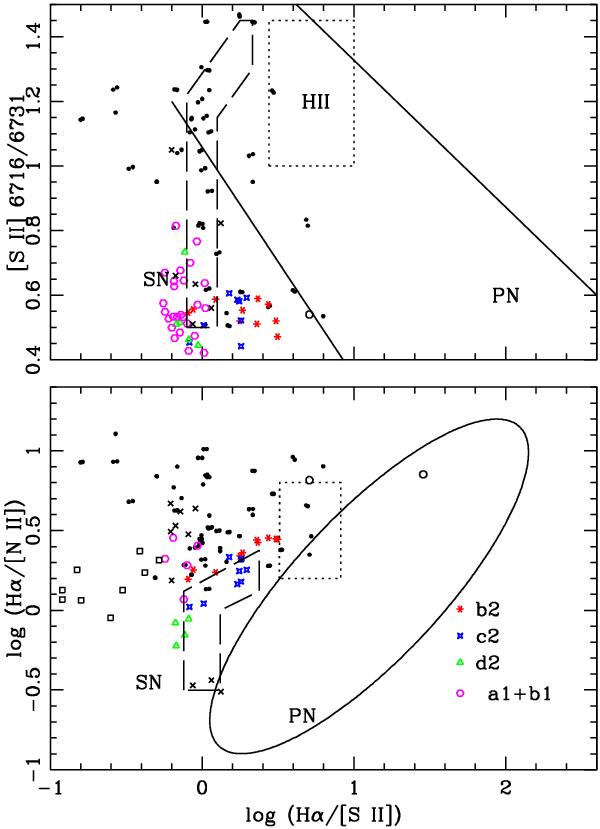
Position of the CRL 618 features in the Hα/[S II] vs. Hα/[N II] and Hα/[S II] vs. [S II] 6716/6731 diagrams. In these diagrams the locations of the H II regions, SNRs and PNe are delineated by solid (PNe), long-dashed (SNRs) and dotted (HII regions) lines (adapted from Riesgo & López 2006). The HH objects (taken from the sample of Raga et al. 1996) are shown as black dots. We have also included several PPNe (taken from Raga et al. 2008) (crosses). The open squares correspond to the irradiated bow-shock models (Raga et al. 2008). The line ratios corresponding to the intrinsic emission of features “b2”, “c2”, “d2” and “a1+b1” are also plotted. The positions of “e1” and “d1” are also shown as open circles; these emission line ratios were obtained by summing across each feature.
Current usage metrics show cumulative count of Article Views (full-text article views including HTML views, PDF and ePub downloads, according to the available data) and Abstracts Views on Vision4Press platform.
Data correspond to usage on the plateform after 2015. The current usage metrics is available 48-96 hours after online publication and is updated daily on week days.
Initial download of the metrics may take a while.