Fig. 5
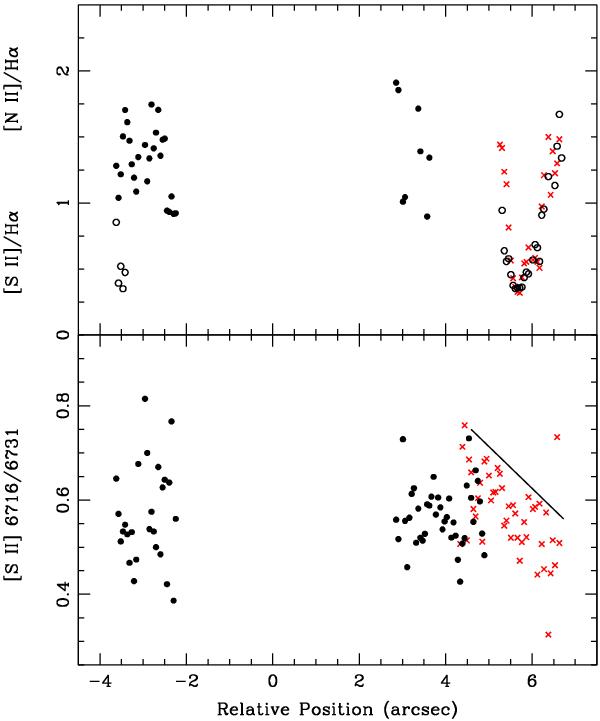
[S II] 6716/6731 (bottom) and [S II] (6716 + 6731)/Hα and [N II] 6548/Hα (× 3.9) (top) obtained for the intrinsic emission as a function of relative distance. The filled dots correspond to points along slit position 1 and the red crosses correspond to points along slit position 2. The [N II] 6548/Hα (× 3.9) emission line ratios from the faint lobe (position 1) and from the “a2” to ”d2” features (position 2) are also shown in the top panel (as open circles). We have drawn a stright line in the bottom panel passing through the peak of the [S II] ratio of features “a2” to “d2” to illustrate the decrease of the [S II] line ratio from “a2” to “d2”.
Current usage metrics show cumulative count of Article Views (full-text article views including HTML views, PDF and ePub downloads, according to the available data) and Abstracts Views on Vision4Press platform.
Data correspond to usage on the plateform after 2015. The current usage metrics is available 48-96 hours after online publication and is updated daily on week days.
Initial download of the metrics may take a while.