Fig. 3
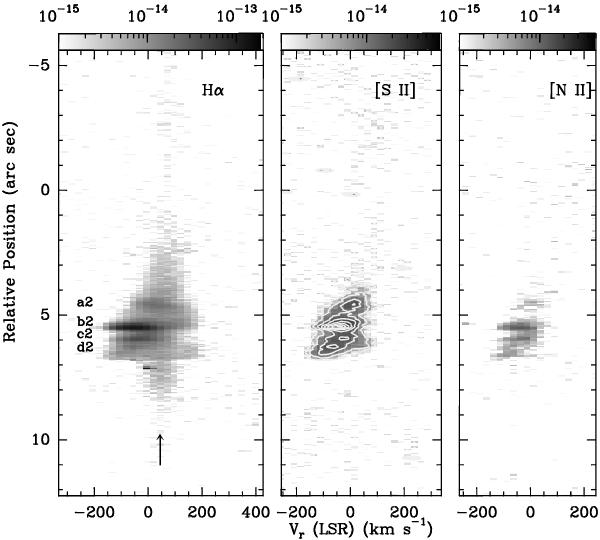
Hα, [S II] 6731 Å and [N II] 6548 Å PV diagrams obtained from the STIS position 2 observations. The PV diagrams are shown with a logarithmic grey scales, with the fluxes given in units of erg cm-2 s-1 Å-1 arcsec-2 by the bars above each plot. Linear contours have been superposed to the [S II] PV map (white contours). The radial velocities were corrected by the systemic velocity (~− 21 km s-1). The ordinate gives position along the slit. The zero position corresponds to the point along the slit closest to the central source. Spectral features are labeled. The vertical arrows aid to identify the redshifted component (see text).
Current usage metrics show cumulative count of Article Views (full-text article views including HTML views, PDF and ePub downloads, according to the available data) and Abstracts Views on Vision4Press platform.
Data correspond to usage on the plateform after 2015. The current usage metrics is available 48-96 hours after online publication and is updated daily on week days.
Initial download of the metrics may take a while.