Fig. 2
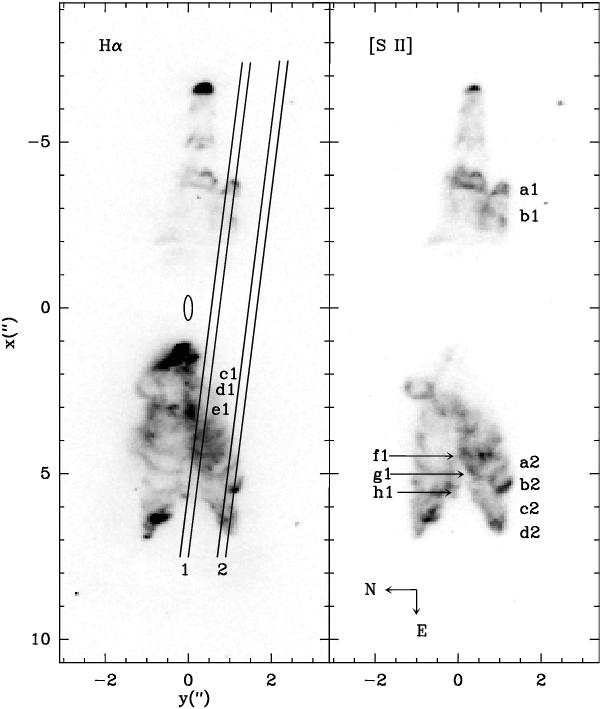
Left: Hα archival HST image (with some contamination of [N II]) of CRL 618 shown with a linear scale (rotated so that the bipolar axis is approximately parallel to the ordinate). The STIS slit positions (“1” and “2”) are superimposed to the HST image. The labels identify the position of several features. The compact central HII region (elongated in the East-West direction) is also overplotted to the Hα image. Right: [S II] archival HST image of CRL 618 shown with a linear scale (rotated so that the bipolar axis is approximately parallel to the ordinate). The labels identify the position of several features.
Current usage metrics show cumulative count of Article Views (full-text article views including HTML views, PDF and ePub downloads, according to the available data) and Abstracts Views on Vision4Press platform.
Data correspond to usage on the plateform after 2015. The current usage metrics is available 48-96 hours after online publication and is updated daily on week days.
Initial download of the metrics may take a while.