Fig. 8
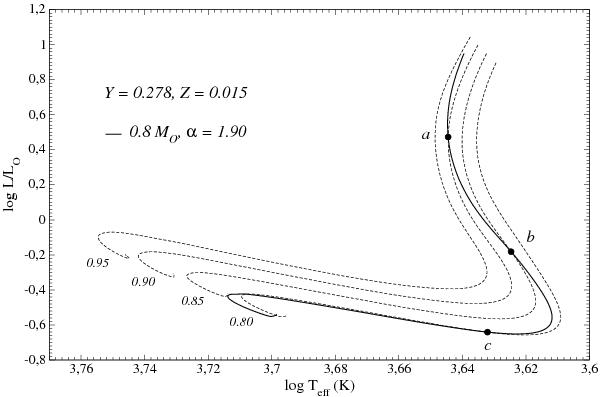
Figure shows that the same position in the HR diagram can be reached by stars of different masses if the α parameter is changed. This effect is shown with respect to a 0.8 M⊙ star model with α = 1.9 (solid line) by comparison with models with α = 1.68 and masses in the range 0.8−0.95 M⊙ (dashed lines). The boundary conditions are the same as our reference set of models.
Current usage metrics show cumulative count of Article Views (full-text article views including HTML views, PDF and ePub downloads, according to the available data) and Abstracts Views on Vision4Press platform.
Data correspond to usage on the plateform after 2015. The current usage metrics is available 48-96 hours after online publication and is updated daily on week days.
Initial download of the metrics may take a while.