Fig. 10
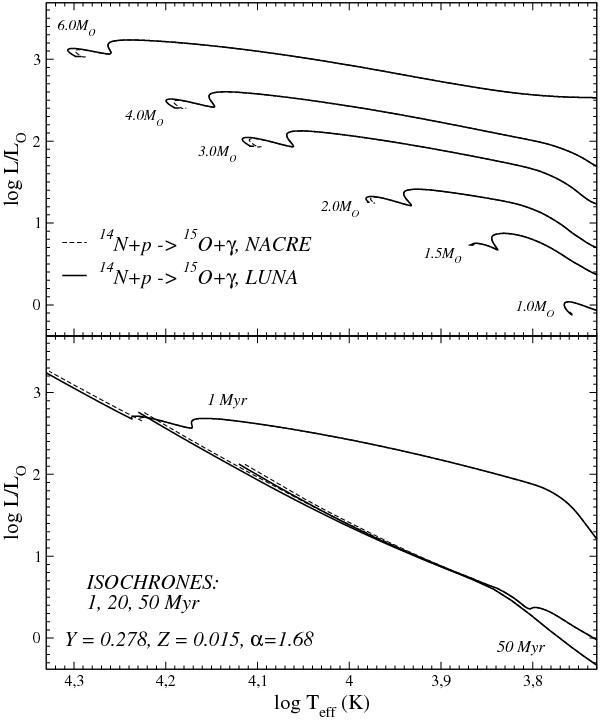
Comparison between models with Z = 0.015, computed adopting the 14N(p, γ)15O reaction rate from LUNA (solid line) and NACRE (dashed line). Upper panel: evolutionary tracks in the HR diagram in the mass range 1−6 M⊙. Bottom panel: isochrones for 1, 20 and 50 Myr.
Current usage metrics show cumulative count of Article Views (full-text article views including HTML views, PDF and ePub downloads, according to the available data) and Abstracts Views on Vision4Press platform.
Data correspond to usage on the plateform after 2015. The current usage metrics is available 48-96 hours after online publication and is updated daily on week days.
Initial download of the metrics may take a while.