Fig. 4
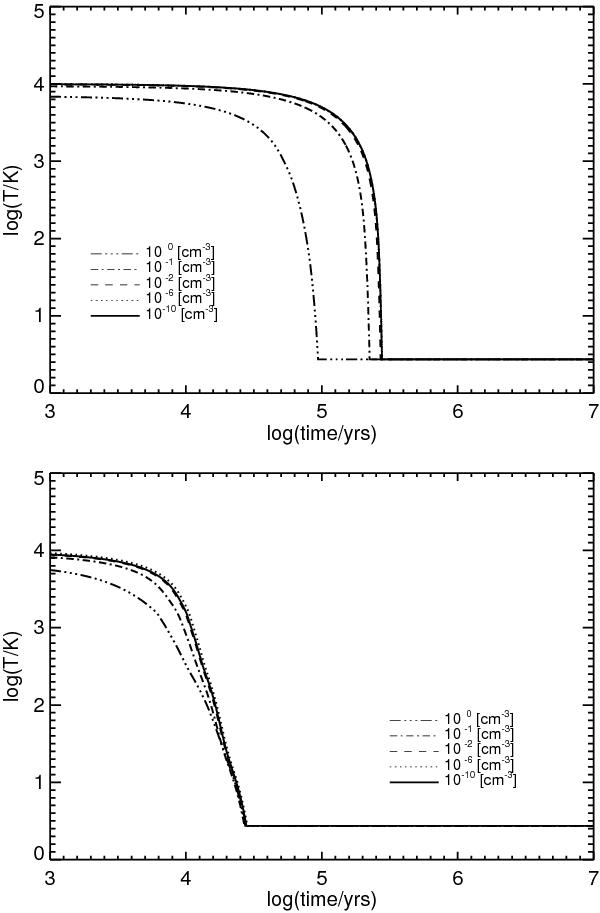
Temperature evolution for different values of the initial H2 densities. The lines represent the time evolution in the cases H2 = 10-10 (solid line), H2 = 10-6 (dotted line), H2 = 10-2 (dashed line), H2 = 10-1 (dashed-dotted line), and finally, H2 = 1 (three dots-dashed line). All the densities are in cm-3. Top panel: the models with Z = 10-10. Bottom panel: the same as in the top panel but for Z = 1. See the text for more details.
Current usage metrics show cumulative count of Article Views (full-text article views including HTML views, PDF and ePub downloads, according to the available data) and Abstracts Views on Vision4Press platform.
Data correspond to usage on the plateform after 2015. The current usage metrics is available 48-96 hours after online publication and is updated daily on week days.
Initial download of the metrics may take a while.