Fig. 20
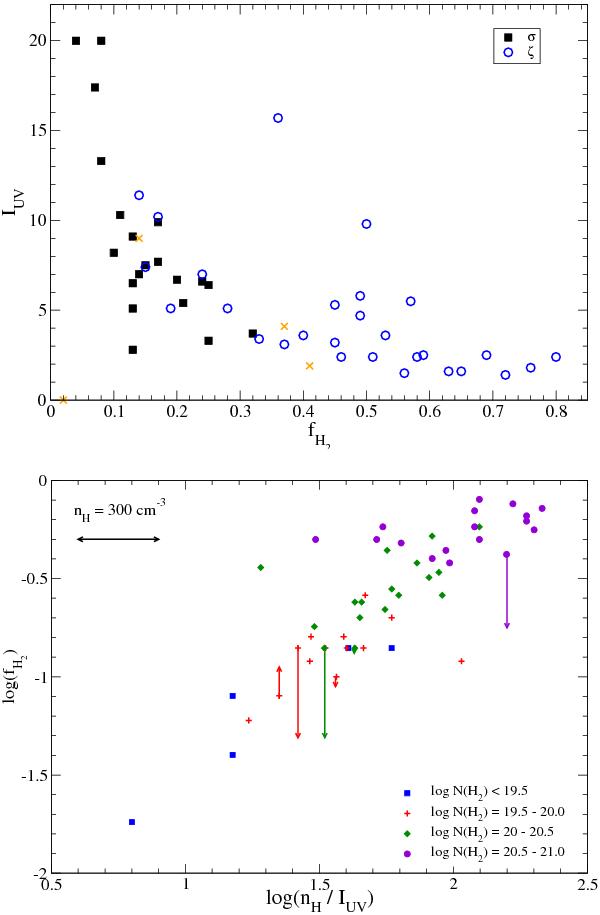
(Top) the model IUV is plotted as a function of inferred fH2. (Bottom) alternatively, the molecular hydrogen fraction can be plotted as a function of the ratio of the hydrogen density of the UV radiation field strength, for our general value of nH = 300.0 cm-3. As expected from Black & van Dishoeck (1987), log(fH2) is directly proportional to log(nH/IUV), where the intercept of this relation depends on the total H2 column density (see also Fig. 2 in Lee et al. 2007). Ranges for inferred N(H2) are indicated by different symbols. The horizontal arrow gives the change in log(nH/IUV) for an increase or decrease of nH by a factor of 2. The vertical arrows on the data points indicate the correction of the inferred fraction to the directly observed fraction. Note that the inferred molecular fraction, fH2, directly depends (non-linearly) on the ratio of W(CH) over W(5780), and the IUV depends also on CH, as well as CN and E(B−V).
Current usage metrics show cumulative count of Article Views (full-text article views including HTML views, PDF and ePub downloads, according to the available data) and Abstracts Views on Vision4Press platform.
Data correspond to usage on the plateform after 2015. The current usage metrics is available 48-96 hours after online publication and is updated daily on week days.
Initial download of the metrics may take a while.