Fig. 2
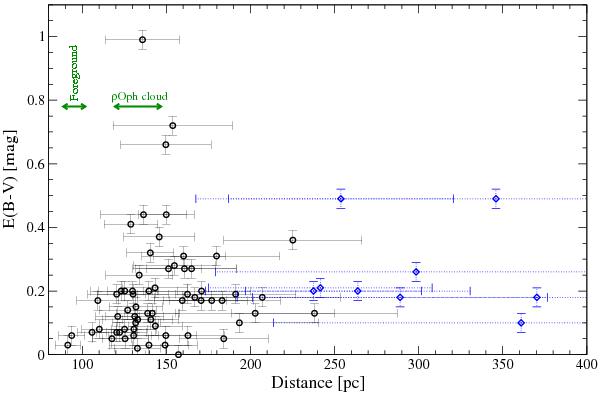
The colour excess E(B−V) (mag) is plotted against the distance of the observed targets (Perryman et al. 1997). Stars with distance errors larger than 50 pc are shown as squares in grey/blue. The low E(B−V) below 120 pc indicates that there is little foreground material in front of Upper Scorpius. The increased scatter at 140 ± 20 pc reflects the density variation associated primarily with the ρ Oph cloud complex. Beyond that distance, no substantial increase of reddening is observed up to 400 pc. A similar figure for the ρ Oph cloud region was shown in Lombardi et al. (2008) (also based on optical photometry, with a partial overlap in the selected sky region).
Current usage metrics show cumulative count of Article Views (full-text article views including HTML views, PDF and ePub downloads, according to the available data) and Abstracts Views on Vision4Press platform.
Data correspond to usage on the plateform after 2015. The current usage metrics is available 48-96 hours after online publication and is updated daily on week days.
Initial download of the metrics may take a while.