Fig. 1
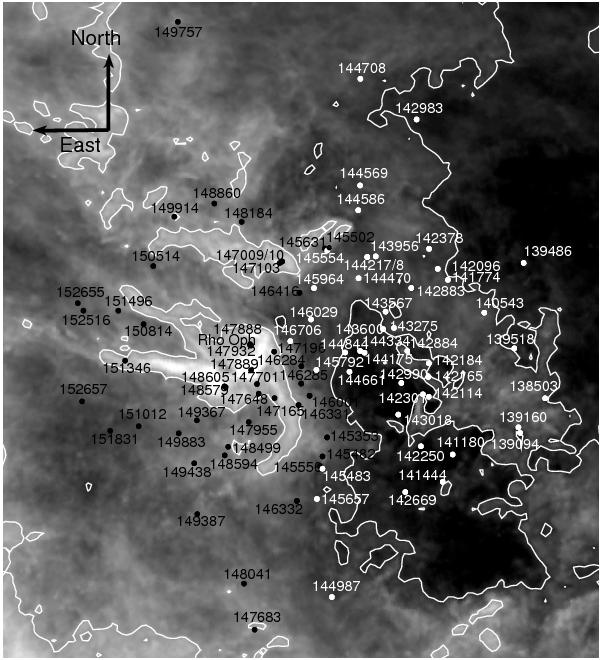
The positions (black and white dots) of the 89 mainly B-type members of Upp Sco are shown (with HD numbers) on top of a 100 μm infrared dust map of this region (Schlegel et al. 1998). The north-east arrows are 3° in length. The ρ Oph cloud can be identified by the bright filamentary emission located just left to the center of the figure. The dust emission (on a logarithmic grey scale) is proportional to the reddening E(B−V) of sightlines penetrating these clouds; the lowest intensities correspond to E(B−V) ~ 0.02 mag (black) and highest intensities to ≥ 2 mag (white). The well-known targets σ Sco (HD 147165, in the ρ Oph cloud) and ζ Oph (HD 149757, top left) are included in our study.
Current usage metrics show cumulative count of Article Views (full-text article views including HTML views, PDF and ePub downloads, according to the available data) and Abstracts Views on Vision4Press platform.
Data correspond to usage on the plateform after 2015. The current usage metrics is available 48-96 hours after online publication and is updated daily on week days.
Initial download of the metrics may take a while.