Fig. 2
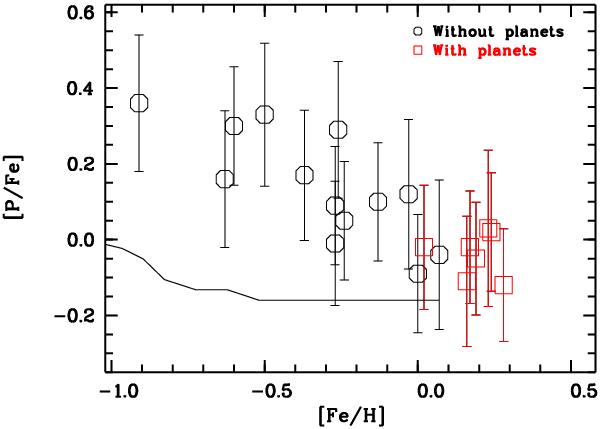
[P/Fe] as a function of the metallicity, [Fe/H]. The dimension of the symbols reflects the average line-to-line scatter of 0.045 dex. The error bars are the sum under quadrature of the uncertainties of P (the linear sum of line-to-line scatter and the systematic uncertainty) and of Fe, the latter assumed to be 0.1 dex for all stars. Stars known to have planets (red squares) have different symbols from stars without known planet (black hexagons). A model of Galactic evolution of P (Kobayashi et al. 2006) is added (solid line) for comparison to the observed data.
Current usage metrics show cumulative count of Article Views (full-text article views including HTML views, PDF and ePub downloads, according to the available data) and Abstracts Views on Vision4Press platform.
Data correspond to usage on the plateform after 2015. The current usage metrics is available 48-96 hours after online publication and is updated daily on week days.
Initial download of the metrics may take a while.