Fig. 1
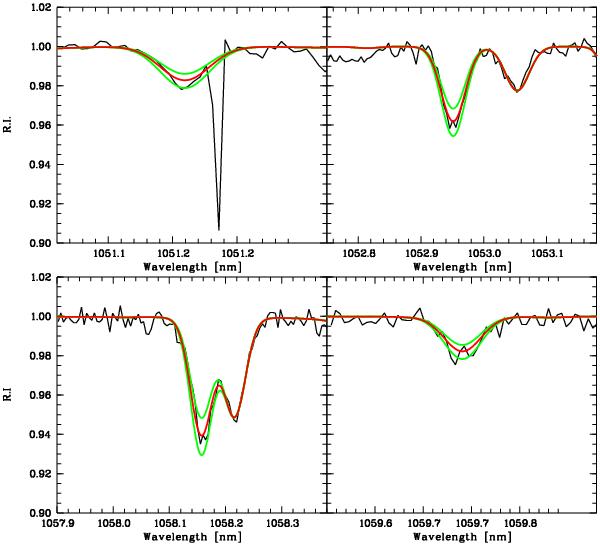
The four P i lines are here shown in the case of HD 13555. The observed spectrum (solid black) is compared to the synthetic profile (solid red) with the P abundance derived from the EW measurement. Also shown are the synthetic profiles obtained by changing the P abundance by ± 0.1 dex (solid green). The telluric absorption affecting the 1051 pm line is clearly visible in the upper-left panel.
Current usage metrics show cumulative count of Article Views (full-text article views including HTML views, PDF and ePub downloads, according to the available data) and Abstracts Views on Vision4Press platform.
Data correspond to usage on the plateform after 2015. The current usage metrics is available 48-96 hours after online publication and is updated daily on week days.
Initial download of the metrics may take a while.